Notice
Recent Posts
Recent Comments
Link
| 일 | 월 | 화 | 수 | 목 | 금 | 토 |
|---|---|---|---|---|---|---|
| 1 | 2 | 3 | 4 | 5 | ||
| 6 | 7 | 8 | 9 | 10 | 11 | 12 |
| 13 | 14 | 15 | 16 | 17 | 18 | 19 |
| 20 | 21 | 22 | 23 | 24 | 25 | 26 |
| 27 | 28 | 29 | 30 |
Tags
- python 갯수세기
- 코테
- iNT
- 파이썬을파이썬답게
- Overleaf
- RMES
- MAPE
- 논문작성
- n_neighbors
- Python
- mes
- n_sample
- TypeError
- 스택
- knn
- Scienceplots
- 평가지표
- KAKAO
- 논문editor
- 논문
- Tire
- PAPER
- 에러해결
- Mae
- Pycaret
- SMAPE
- mMAPE
- 카카오
- Alignments
- 프로그래머스
Archives
- Today
- Total
EunGyeongKim
[paper] Matplotlib으로 논문용 figure그리기 본문
SciencePlots
Format Matplotlib for scientific plotting
pypi.org
1. latex 깔아주기
!sudo apt-get install dvipng texlive-latex-extra texlive-fonts-recommended cm-super
2. font 깔아주기
# Ubuntu / Debian
sudo apt update
sudo apt install fonts-noto-cjk

# macOS
brew tap homebrew/cask-fonts
brew cask install font-noto-serif-cjk-tc
brew cask install font-noto-serif-cjk-sc
brew cask install font-noto-serif-cjk-jp
brew cask install font-noto-serif-cjk-kr

# archlinux
sudo pacman -S noto-fonts-cjk
3. font 깔고 rebuild 하기
import matplotlib.font_manager as fm
fm._rebuild()
4. matplotlib 위치 확인
import matplotlib
print(matplotlib.get_configdir())
-> /root/.config/matplotlib
5. matplotlib시 default가 아닌 다른폰트 설정
import matplotlib.pyplot as plt
plt.style.use('science')
plt.rcParams.update({
    "font.family": "serif",   # specify font family here
    "font.serif": ["Times"],  # specify font here
    "font.size":11})          # specify font size here
6. Scienceplots 깔기
!pip install SciencePlots
import matplotlib.pyplot as plt
plt.style.reload_library()
plt.style.use('science')
7. 사용!!!! style 지정해서 사용하기
import matplotlib.pyplot as plt

plt.style.use('science')
예시 : style.use(science)
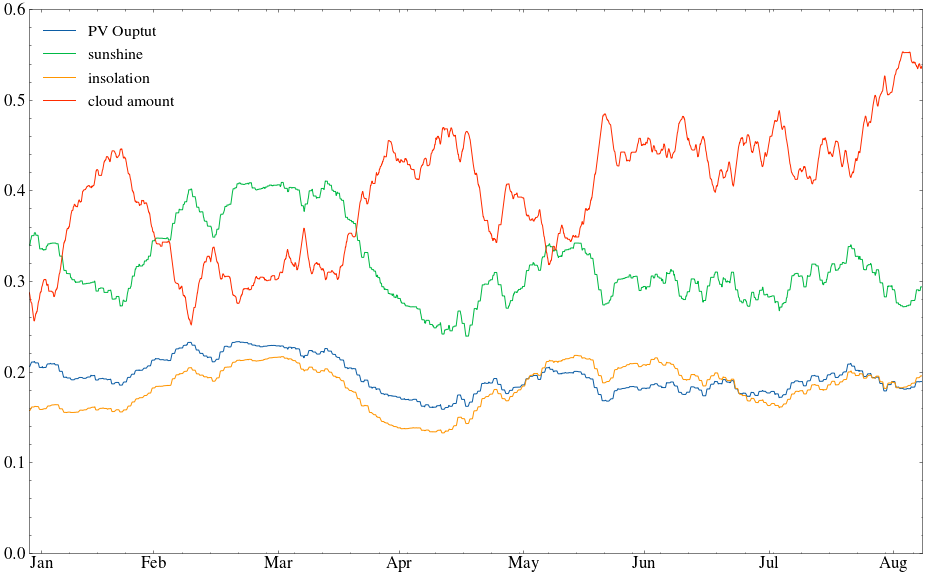
style.use(science, ieee)
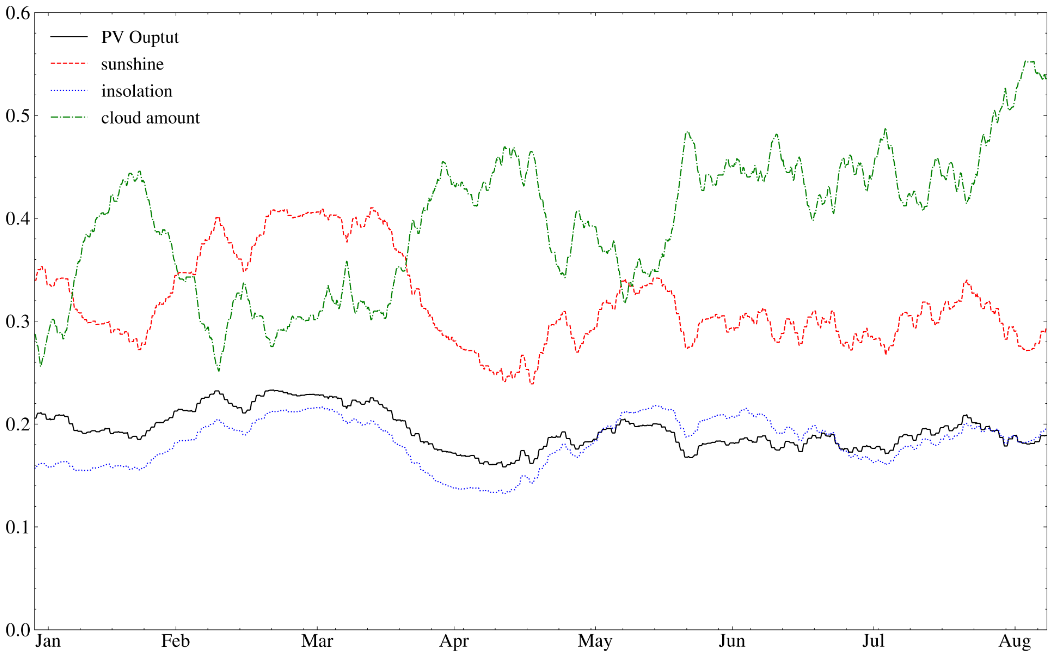
이 이외에도 여러 템플릿이 있다!
템플릿 확인은 링크 에서 확인!!
이제 논문 형식에 맞는것을 찾아 적용하면 끝!!1
figure 못그린다고 이제 야단 안맞아도 되겠다 ㅎㅎㅎㅎ
'Language > Python' 카테고리의 다른 글
| [Python] 유클리드 호제법 (0) | 2022.09.06 |
|---|---|
| [데이터 구조 및 분석] Linked List 코드 (0) | 2022.08.12 |
| [Python] collection모듈의 counter (0) | 2022.08.09 |
| [Python] int 진법 변환 시 에러 (0) | 2022.08.05 |
| [프로그래머스] 파이썬을 파이썬답게 정리 (0) | 2022.08.04 |
'Language/Python' Related Articles
more

Comments